$1,470.00 – $1,790.00
The Contrast Resolution Chart is useful for the visualization and measurement of contrast separations that are observable within patches that range from light to dark. This can be useful to see how observable objects are within different contexts that could be impacted by flare light and nonlinear signal processing.
Analysis of the Contrast Resolution chart is included in the Color/Tone Setup and Color/Tone Interactive modules. See here for more details about Contrast Resolution.
Description
The physical chart consists of layers of 8×10 inch photographic film. The chart contains 20 large patches with densities ranging from base + 0.15 to base + 4.90 (OD = Optical Density) in steps of 0.25 OD, equivalent to 95 dB. (If the lightest and darkest small patches are included, the total density range is 5.1 OD = 102 dB.) Inside each large square there are four color squares: light and dark gray, red and blue. The gray patches are 0.15 OD above and below the surrounding square. The difference, 0.30 OD, is a 2:1 contrast ratio.
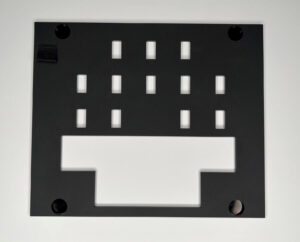
The Contrast Resolution Chart pairs with the Veiling Glare Mask and Frame to reduce light entering the camera from the twelve lightest patches by 86%. Stray light from these patches is the primary cause of “veiling glare”, which fogs the darkest patches on the chart and limits Dynamic Range (DR).
For more details see Analysis of the Contrast Resolution chart